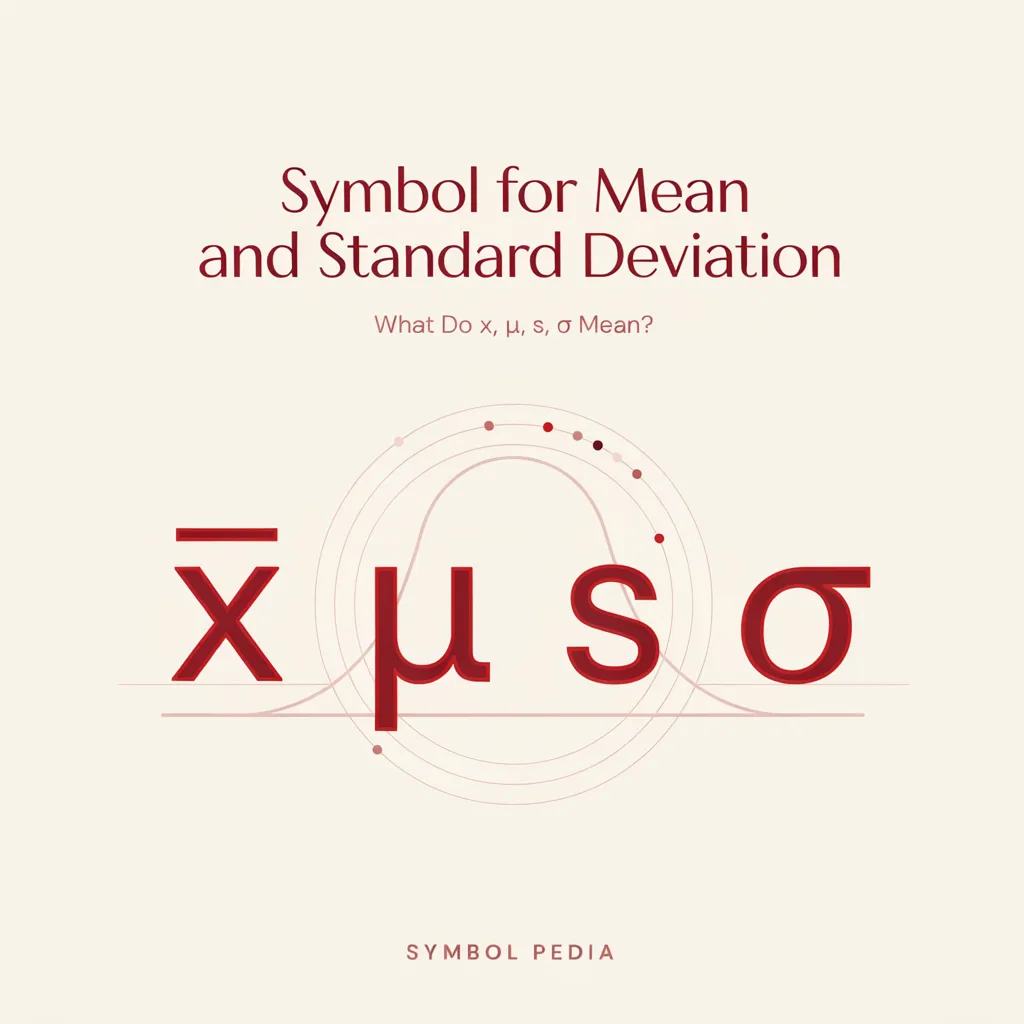
If you have ever looked at a statistics formula and wondered what the symbols x̄, μ, s, and σ actually mean, you are not alone. Statistics uses a small collection of symbols to represent ideas that would otherwise require long explanations.
The symbol for mean is commonly written as x̄ for a sample mean and μ (mu) for a population mean. The symbol for standard deviation is usually s for a sample standard deviation and σ (sigma) for a population standard deviation.
At first, these symbols can look intimidating. In practice, they are simply shortcuts. Once you understand what each one represents, reading statistical formulas becomes much easier.
This guide explains the meaning of these symbols, where they come from, how they are used, the differences between sample and population statistics, and how to recognize them in real-life situations.
Symbol for Mean and Standard Deviation – Quick Meaning
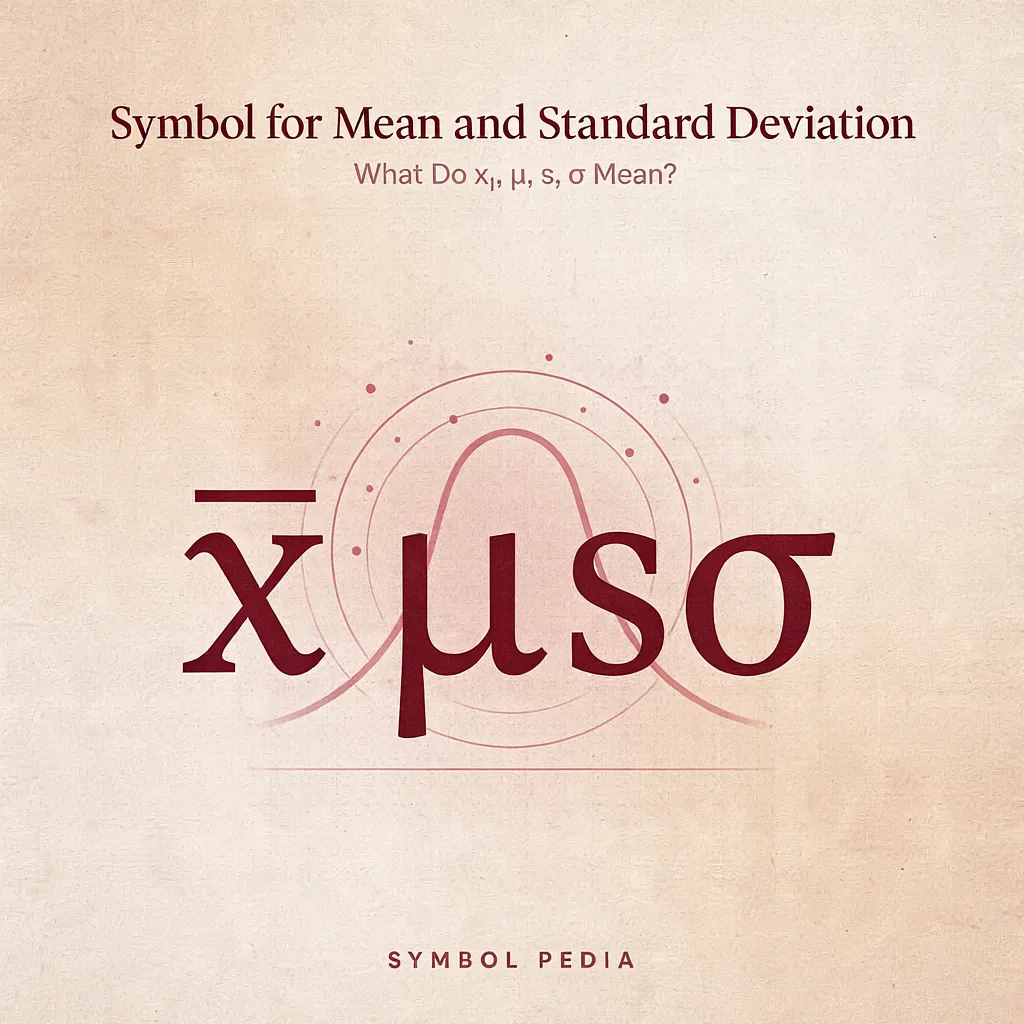
The most important thing to remember is that the symbols depend on whether you are working with a sample or an entire population.
Symbols for the mean
- x̄ (x-bar) = sample mean
- μ (mu) = population mean
The mean is the ordinary average of a group of numbers.
For example, if five students score 70, 75, 80, 85, and 90, their mean is:
(70 + 75 + 80 + 85 + 90) ÷ 5 = 80
So, the sample mean can be written as:
x̄ = 80
Symbols for standard deviation
- s = sample standard deviation
- σ (sigma) = population standard deviation
Standard deviation tells you how spread out the numbers are around the mean.
A small standard deviation means the values tend to stay close to the average. A larger standard deviation means the values are more widely scattered.
You might see these symbols in a textbook as:
“The sample mean is x̄ = 72.”
Or:
“The population standard deviation is σ = 6.”
Another common statement is:
“The sample standard deviation is s = 4.5.”
The symbols may look unfamiliar at first, but they are simply mathematical labels.
Origin & Background of the Mean and Standard Deviation Symbols
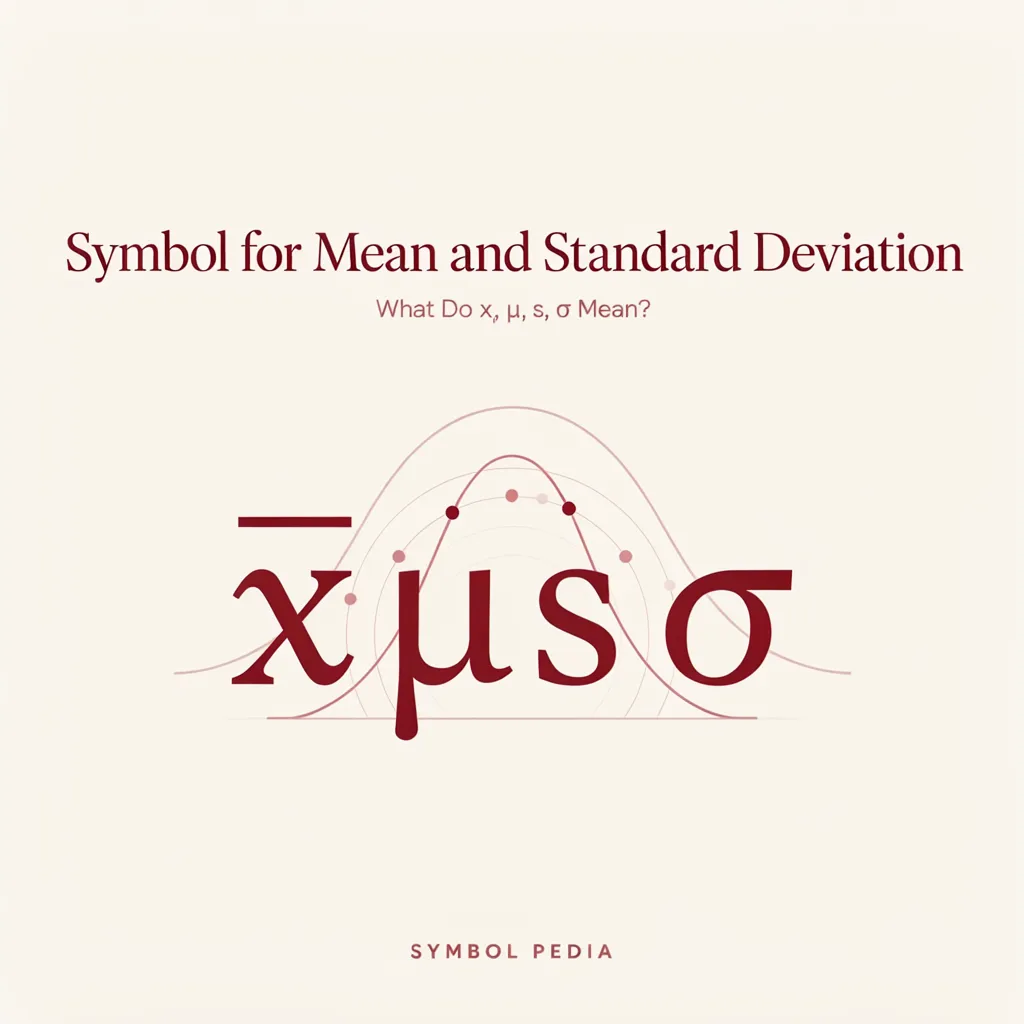
The symbols used in statistics developed alongside the broader language of mathematics, probability, and scientific measurement.
The idea of finding an average is extremely old. People have used forms of averaging for centuries when comparing measurements, calculating costs, studying populations, and analyzing observations.
The modern statistical notation became more standardized as mathematics and statistics developed into formal academic disciplines.
The letter μ became associated with the population mean. It comes from the Greek letter mu, which is widely used in mathematics and science to represent different quantities.
The symbol σ, pronounced “sigma,” is also a Greek letter. In statistics, lowercase sigma is strongly associated with population standard deviation.
The horizontal line over x, creating x̄, is a convenient notation for an average of observed x-values. It is read as “x-bar.”
The distinction between x̄ and μ is especially important.
If you calculate the average age of every person in a particular population, you are dealing with a population mean, μ.
If you survey only 100 people from that population and calculate their average age, that result is a sample mean, x̄.
Similarly, σ refers to the population standard deviation, while s commonly represents the standard deviation calculated from a sample.
Has social media changed these symbols?
Not really.
Unlike internet abbreviations such as “LOL” or “IDK,” statistical symbols have not developed different meanings because of social media.
However, social media, online courses, educational videos, and digital study communities have made statistical notation more visible to beginners. Students often encounter x̄, μ, s, and σ online before they have formally studied statistics.
That can make the symbols seem more complicated than they really are.
Real-Life Conversations About Mean and Standard Deviation
Mathematical symbols can feel abstract until they appear in an everyday conversation. Here are a few realistic examples.
WhatsApp Conversation
Person A:
I calculated the average marks, but my teacher wrote x̄ instead of “mean.”
Person B:
Yep, x-bar usually represents the sample mean.
Person A:
So μ is different?
Person B:
Usually, yes. μ represents the population mean.
Person A:
Okay, that finally makes sense.
Instagram DM
Person A:
What does that weird σ symbol mean in your statistics notes?
Person B:
Sigma. In statistics, lowercase σ often means population standard deviation.
Person A:
And “s” is sample standard deviation?
Person B:
Exactly. That distinction confused me too at first.
TikTok Comment
Person A:
Why are there so many symbols just for average and spread? 😭
Person B:
Because statistics loves abbreviations 😂
Person A:
So x̄ = sample average and s = sample standard deviation?
Person B:
Yes! And μ and σ are commonly used for the population versions.
Text Message
Person A:
My homework says “find μ and σ.” What am I supposed to calculate?
Person B:
The population mean and population standard deviation.
Person A:
So μ tells me the center and σ tells me the spread?
Person B:
Exactly. That’s the easiest way to remember them.
Emotional & Psychological Meaning of These Symbols
Mathematical symbols do not normally have emotional meanings in the way emojis or slang do. Still, they can create strong emotional reactions for learners.
For many beginners, seeing μ or σ on a page immediately creates a feeling of uncertainty. A simple concept such as “average” suddenly looks more difficult because it has been given a Greek letter.
This is a common psychological effect in mathematics: unfamiliar notation can make a familiar idea feel complicated.
The important shift is to stop seeing the symbols as mysterious objects.
Think of x̄ as simply “the sample’s average.”
Think of s as “the sample’s amount of spread.”
Think of μ as “the population’s average.”
Think of σ as “the population’s amount of spread.”
I have found that once students translate the symbols into ordinary language, statistical formulas become considerably less intimidating.
The real skill is not memorizing four symbols in isolation. It is recognizing which symbol belongs to which situation.
Usage in Different Contexts
1. Social Media and Online Learning
You may see x̄, μ, s, and σ in educational posts, statistics tutorials, study videos, and online discussions.
For example, someone might write:
x̄ = 65, s = 8
That generally means the sample has an average of 65 and a sample standard deviation of 8.
Online, people sometimes simplify explanations by calling x̄ “average” and σ “standard deviation.” That is useful for beginners, but technically the population-versus-sample distinction still matters.
2. Friends and Student Conversations
Students often use the symbols when discussing exams, grades, experiments, or research projects.
For example:
“Our sample mean x̄ was 74.”
That is a concise way of saying that the average value in the sample was 74.
3. Work and Professional Settings
These symbols are common in fields such as business analytics, economics, psychology, medicine, engineering, education, and scientific research.
A report might say that a population has a mean μ and standard deviation σ.
In a practical workplace, however, the symbols should always be defined if the audience is not statistically trained.
4. Casual vs. Serious Use
There is little difference in the symbols themselves between casual and formal settings.
The main difference is explanation.
In a classroom, a professor may assume you understand what σ means.
In a presentation for non-statisticians, it is usually better to write:
Average = 75
and then explain the standard deviation in plain language.
When NOT to Use These Symbols
There are several situations where using statistical notation without explanation can cause unnecessary confusion.
Don’t use x̄ when you mean a population mean
If you are specifically describing an entire population, μ is generally the appropriate notation for its mean.
Don’t use σ automatically for every standard deviation
If you calculated standard deviation from a sample, s is commonly used rather than σ.
Don’t assume everyone understands Greek letters
A statistics professor may immediately recognize σ.
A customer, manager, parent, or beginner may not.
When communicating outside a statistical setting, define the symbol before relying on it.
Don’t confuse σ with Σ
This is one of the most common visual mistakes.
- σ = lowercase sigma, commonly used for population standard deviation
- Σ = uppercase sigma, commonly used for summation
They are related Greek letters but serve very different roles in statistical notation.
Common Misunderstandings About the Mean and Standard Deviation Symbols
“x̄ and μ mean exactly the same thing.”
They both represent means, but they are generally used in different situations.
x̄ usually represents a sample mean, while μ represents a population mean.
“s and σ are interchangeable.”
Not necessarily.
s commonly represents a sample standard deviation.
σ commonly represents a population standard deviation.
The formulas used to calculate them can also differ.
“Standard deviation is another type of average.”
No.
The mean describes the center of the data.
Standard deviation describes the spread of the data around that center.
“A larger standard deviation means a larger average.”
No.
Mean and standard deviation measure different characteristics.
Two datasets can have exactly the same mean but very different standard deviations.
“The symbols have different meanings on social media.”
Generally, no.
Their meanings come from mathematical and statistical conventions, not from internet slang.
“Sigma always means standard deviation.”
Not always.
Lowercase σ is commonly used for population standard deviation, but Greek letters can have different meanings in different branches of mathematics and science.
Context matters.
Comparison Table: Mean and Standard Deviation Symbols
| Symbol | Common Name | Usually Represents | Sample or Population? | Main Idea |
|---|---|---|---|---|
| x̄ | x-bar | Sample mean | Sample | Average of sample values |
| μ | Mu | Population mean | Population | Average of all population values |
| s | s | Sample standard deviation | Sample | Spread within a sample |
| σ | Sigma | Population standard deviation | Population | Spread within a population |
| Σ | Capital sigma | Summation | Either | Adds values together |
| M | M | Mean in some contexts | Depends | Another notation sometimes used for mean |
| SD | Standard deviation | Standard deviation | Depends | Written abbreviation rather than a specific symbol |
Key Insight
The easiest way to remember the system is to separate center from spread and sample from population: x̄/μ describe the center, while s/σ describe the spread.
How to Respond When Someone Uses These Symbols
If someone mentions these symbols in conversation, your response can depend on the situation.
Casual replies
- “So x-bar is the sample average?”
- “Got it—σ is the population standard deviation.”
- “That makes more sense now.”
- “So the mean is the center and SD is the spread?”
Funny replies
- “Greek letters just entered the statistics chat. 😂”
- “Why does an average need a whole costume?”
- “Okay, sigma, I see you.”
- “Statistics really said: let’s make this look complicated.”
Mature replies
- “So the notation depends on whether we’re describing a sample or a population.”
- “I understand the distinction between the mean and standard deviation now.”
- “Could you clarify whether you mean the sample or population value?”
Respectful replies
- “Could you explain what the symbol represents in this context?”
- “I understand the concept, but I want to make sure I’m reading the notation correctly.”
- “Does σ refer to the population standard deviation here?”
Asking for clarification is completely reasonable. Statistical notation can vary slightly between textbooks and fields.
Regional & Cultural Usage
Unlike slang, the mathematical symbols for mean and standard deviation are largely international.
A student in one country can usually recognize x̄, μ, s, and σ in a statistics textbook from another country.
Western Culture
In the United States, Canada, the United Kingdom, Australia, and other Western education systems, x̄, μ, s, and σ are widely recognized statistical notation.
Different textbooks may introduce the symbols in slightly different ways.
Asian Culture
Statistics education across Asian countries also commonly uses internationally recognized mathematical notation.
Students may encounter the same symbols in mathematics courses, research papers, university examinations, and scientific studies.
The surrounding explanation may differ because educational systems use different teaching styles, but the basic notation remains broadly consistent.
Middle Eastern Culture
Mathematical notation is also commonly shared across international academic materials in Middle Eastern education.
Students studying statistics may encounter μ and σ even when the surrounding textbook or instruction is in Arabic or another local language.
Global Internet Usage
Online education has made statistical notation even more international.
A student can watch a statistics lesson created in another country and still encounter familiar symbols such as x̄, μ, s, and σ.
That shared notation is one reason mathematics can cross language barriers so effectively.
Gen Z vs. Millennials
There is no meaningful generational difference in the mathematical definitions of these symbols.
Gen Z students and Millennials may communicate about them differently, particularly on social media, but x̄ still represents a sample mean and σ still commonly represents population standard deviation.
The main difference is communication style, not mathematical meaning.
Is the Symbol for Mean and Standard Deviation Safe for Kids?
Yes. These statistical symbols are completely safe for children and students.
They are standard educational notation used to teach averages, variation, probability, data analysis, and scientific reasoning.
For younger learners, however, it is better to introduce the underlying concepts before asking them to memorize symbols.
A child can first learn:
Mean = average
Standard deviation = how spread out the numbers are
Once those ideas are comfortable, introducing x̄, μ, s, and σ becomes much less overwhelming.
FAQs About the Symbol for Mean and Standard Deviation
What is the symbol for mean?
The most common symbol for a sample mean is x̄, pronounced “x-bar.” The symbol μ is commonly used for a population mean.
What is the symbol for standard deviation?
The standard deviation symbol is commonly σ (sigma) for a population and s for a sample.
What does x̄ mean in statistics?
x̄ means the sample mean, or the average value calculated from a sample.
What does μ mean in statistics?
μ, pronounced “mu,” commonly represents the mean of an entire population.
What does σ mean in statistics?
σ, pronounced “sigma,” commonly represents the standard deviation of a population.
What is the difference between s and σ?
s commonly represents a sample standard deviation, while σ commonly represents a population standard deviation.
Is Σ the same as σ?
No. Σ is uppercase sigma and is commonly used as a summation symbol. σ is lowercase sigma and commonly represents population standard deviation in statistics.
Conclusion
The symbol for mean and standard deviation may look complicated at first, but the underlying ideas are surprisingly simple.
Think of the mean as the center of your data and standard deviation as the spread around that center.
For samples, you will commonly see x̄ for the mean and s for standard deviation.
For populations, you will commonly see μ for the mean and σ for standard deviation.
The most useful memory trick is:
x̄ = sample average
μ = population average
s = sample spread
σ = population spread
Once you understand that pattern, statistics starts to feel less like a wall of unfamiliar symbols and more like a language you can actually read.
And that is the real purpose of mathematical notation: not to make simple ideas harder, but to express them quickly and precisely.
descover more post
What Does the Satellite Symbol Mean on iPhone Meaning …
Statistical Symbol for Mean What It Means How to Use It and …
What Does the Swastika Symbol Mean History Religion and …

Orvian is a passionate researcher and dedicated content creator focused on exploring the deeper meanings behind symbols, signs, and cultural interpretations. With a strong interest in symbolism and human psychology, Orvian simplifies complex ideas into clear, engaging, and easy-to-understand content for readers around the world.
Through consistent research and thoughtful writing, Orvian aims to provide accurate, insightful, and meaningful information that helps users connect with symbols on a deeper level—whether for personal growth, curiosity, or knowledge.
Known for a hardworking mindset and attention to detail, Orvian believes that every symbol carries a story, and every story deserves to be understood.