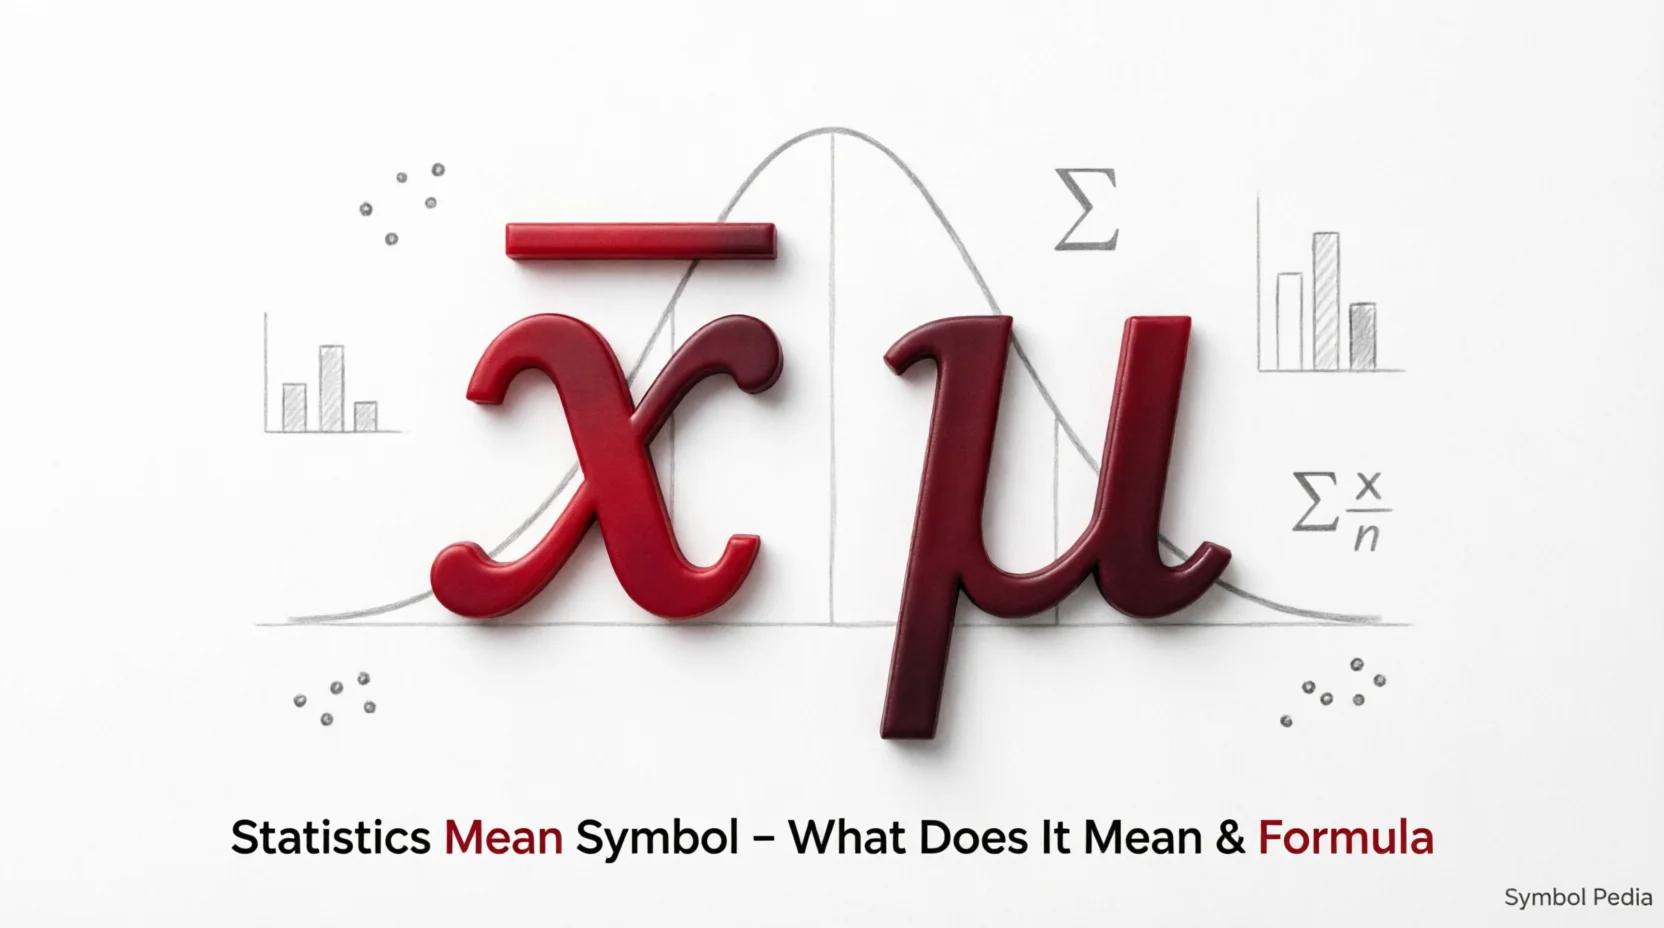
If you have ever looked at a statistics problem and wondered what the little line above an x means, you are not alone. The symbol x̄ appears frequently in statistics, yet many beginners are unsure what it represents or how it differs from other symbols such as μ.
The statistics mean symbol is used to represent an average. However, the exact symbol depends on whether you are talking about a sample or an entire population.
In most basic statistics problems, x̄ (x-bar) represents the sample mean, while μ (mu) represents the population mean. Understanding this small distinction can make formulas, research papers, spreadsheets, and statistical results much easier to read.
This guide explains what the statistics mean symbol is, where it comes from, how it is used, and how to recognize it in real-world examples.
Statistics Mean Symbol – Quick Meaning
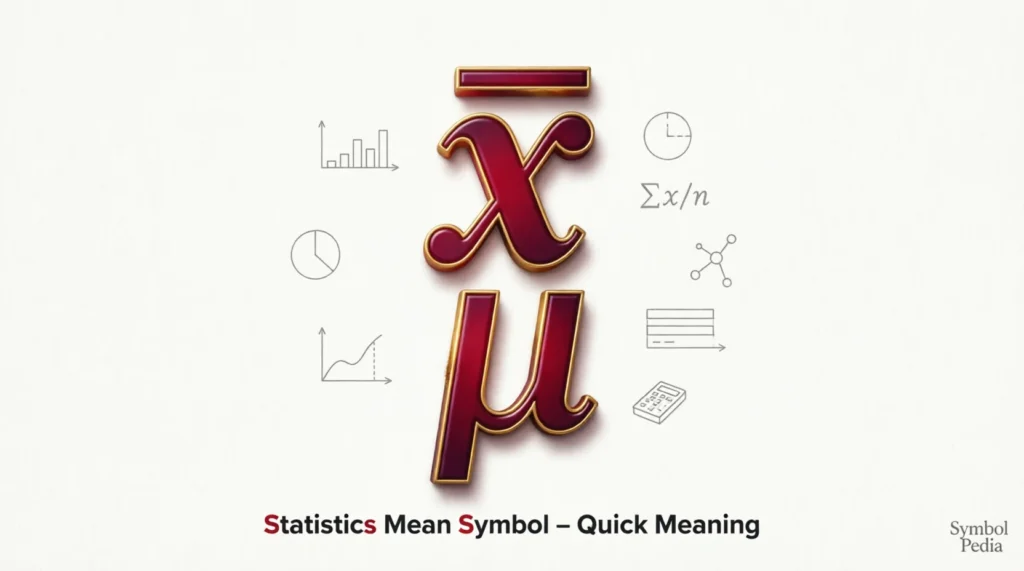
The statistics mean symbol is a mathematical notation used to represent the average value of a group
of numbers.
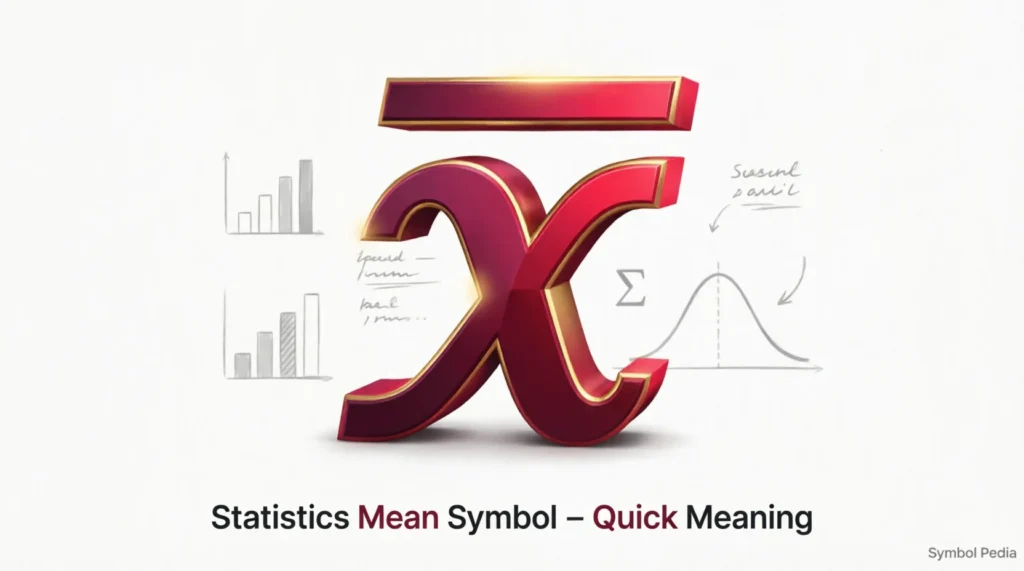
The two symbols you will encounter most often are:
- x̄ = sample mean
- μ = population mean
The sample mean is calculated by adding all observations in a sample and dividing the total by the number of observations.
Sample mean formula
x̄ = Σx / n
Here:
- x̄ = sample mean
- Σx = sum of all sample values
- n = number of values in the sample
For example, suppose five students receive these scores:
70, 75, 80, 85, 90
Add them together:
70 + 75 + 80 + 85 + 90 = 400
Then divide by 5:
400 ÷ 5 = 80
Therefore:
x̄ = 80
In simple language, you could say:
“The sample mean is 80.”
Or:
“The average score is 80.”
Another example might be:
“The x̄ for the survey responses is 4.2.”
That simply means the average response was 4.2.
What Does x̄ Mean in Statistics?
The symbol x̄, pronounced “x-bar,” usually represents the arithmetic mean of a sample.
The horizontal bar placed above the letter x is important. It tells the reader that the value represents an average rather than an individual observation.
For example:
x₁, x₂, x₃, x₄
can represent individual observations.
But:
x̄
represents their average.
Consider four temperatures:
20, 22, 24, 26
Their mean is:
(20 + 22 + 24 + 26) ÷ 4 = 23
So:
x̄ = 23
This notation allows statisticians to communicate a fairly complicated idea with one small symbol.
What Does μ Mean in Statistics?
The Greek letter μ (mu) is commonly used to represent the population mean.
The distinction between x̄ and μ is one of the most important ideas for statistics beginners.
A sample is a smaller group selected from a larger population.
For example, imagine a university has 20,000 students. A researcher might survey 500 students instead of asking every student.
The 500 students are the sample.
The 20,000 students represent the population.
The average of those 500 surveyed students is represented by:
x̄
The actual average of all 20,000 students is represented by:
μ
So, a useful memory trick is:
x̄ → sample mean
μ → population mean
Origin & Background of the Statistics Mean Symbol
The idea of an average is much older than modern statistical notation.
People have been calculating averages for centuries when comparing measurements, prices, populations, observations, and other quantities. What changed over time was the development of standardized mathematical notation.
The use of a horizontal bar to indicate an average became an efficient way of distinguishing an average value from an individual observation.
Instead of writing a phrase such as “the average of all x values” every time, mathematicians could simply write x̄.
That small change made equations considerably easier to read.
The Greek letter μ, meanwhile, became widely associated with the population mean in statistical notation. Today, these conventions are taught in schools, universities, scientific research, economics, business analytics, and many other fields.
Why notation matters
Mathematical symbols are essentially a shared language.
Someone in Canada, India, the United Kingdom, the United States, or another country can see:
x̄ = 72
and understand that the sample’s average is 72.
That universality is one reason statistical symbols remain so useful.
Influence of modern technology
Today, people encounter mean notation outside traditional mathematics classrooms.
Statistics appear in:
- Data-analysis software
- Research reports
- Academic papers
- Business dashboards
- Excel worksheets
- Online calculators
- Scientific studies
- Sports analytics
- Educational reports
Although software can calculate an average instantly, understanding x̄ and μ remains important because technology gives you an answer, but notation tells you what that answer actually represents.
Real-Life Conversations About the Statistics Mean Symbol
Statistics notation can seem intimidating until it appears in an ordinary conversation. Here are a few realistic examples.
WhatsApp Conversation
Person A:
I’m stuck on my statistics homework. What does x̄ mean?
Person B:
That’s x-bar. It usually means the sample mean, basically the average.
Person A:
So if my five numbers average 18, then x̄ = 18?
Person B:
Exactly.
Instagram DM
Person A:
Why does my professor use μ in one question and x̄ in another?
Person B:
μ is usually the population mean, while x̄ is the sample mean.
Person A:
Ohhh, so they aren’t interchangeable?
Person B:
Not usually. The difference is whether you’re describing the whole population or a sample.
TikTok Comments
Person A:
What is the little line over x supposed to mean?
Person B:
It’s called x-bar. In statistics, it represents the sample average.
Person A:
I thought it was just a weird-looking x 😂
Person B:
Honestly, I thought the same thing at first.
Text Message
Person A:
My teacher wrote x̄ = 64. What am I supposed to do with that?
Person B:
It means the mean of the sample is 64.
Person A:
So basically the average?
Person B:
Yep. “Mean” and “average” are often referring to the same calculation here.
Emotional & Psychological Meaning of the Statistics Mean Symbol
At first glance, x̄ seems emotionally neutral. It is simply mathematical notation. But there is an interesting psychological side to learning symbols.
A small symbol can create unnecessary anxiety when someone does not know what it means.
A student may see:
x̄ = Σx/n
and immediately think the problem is complicated.
Once they learn that x̄ simply means “sample average,” the same equation becomes much less intimidating.
This is common when learning mathematics. Familiarity changes perception.
I remember the first time a statistical formula really made sense to me: the important moment wasn’t memorizing the equation. It was realizing that the symbols were simply abbreviations for ideas I already understood.
That is the real value of learning statistical notation. You stop seeing mysterious marks and start seeing meaning.
The statistics mean symbol essentially compresses the idea of “average of the sample” into one convenient character.
Usage of the Statistics Mean Symbol in Different Contexts
1. Social Media
People occasionally use statistical notation when discussing averages, surveys, grades, polls, fitness data, or experiments online.
For example:
“The x̄ of the five test scores was 88.”
Among casual users, however, the word average is much more common.
2. Friends and Relationships
You might encounter mean notation when helping a friend with homework or discussing personal data.
For example, someone might calculate the average number of hours they sleep each night:
x̄ = 7.1 hours
The symbol makes the calculation concise.
3. Work and Professional Settings
Mean notation is especially useful in professional research and data analysis.
Businesses may calculate average:
- Sales
- Customer ratings
- Response times
- Employee performance scores
- Monthly revenue
- Delivery times
A report might state that the sample mean customer waiting time was x̄ = 12.4 minutes.
4. Casual vs. Serious Tone
In casual conversation, saying “the average was 12” is usually clearer.
In an academic report, however, x̄ = 12 may be more appropriate because readers expect mathematical notation.
The best choice depends on your audience.
When NOT to Use the Statistics Mean Symbol
The symbol x̄ is useful, but it should not be forced into every situation.
Don’t use it when plain English is clearer
If you’re explaining an average to someone who has never studied statistics, saying:
“The average score was 82.”
may be much easier than writing:
“x̄ = 82.”
Don’t confuse sample and population data
One of the biggest mistakes is using x̄ when you are actually referring to a population mean.
Remember:
x̄ = sample mean
μ = population mean
Don’t assume every x with a line means the same thing everywhere
Mathematical notation can vary between textbooks, disciplines, and contexts.
The surrounding definition always matters.
Don’t use statistical notation without explaining it
In a professional report intended for a general audience, unexplained symbols can make information harder to understand.
Clear communication matters more than showing off mathematical notation.
Common Misunderstandings About the Statistics Mean Symbol
“x̄ means any average.”
Not necessarily.
In standard statistics notation, x̄ usually refers specifically to the sample mean.
“μ and x̄ are exactly the same.”
They represent the same type of calculation—an arithmetic mean—but refer to different groups.
x̄ describes a sample, while μ describes a population.
“The bar is a minus sign.”
No.
The horizontal line above x is part of the notation. It is not subtraction.
“Mean always means median.”
No.
The mean, median, and mode are different measures of central tendency.
The mean is calculated by adding values and dividing by their number.
“A mean must be a whole number.”
Not at all.
A mean can be a decimal.
For example:
10, 11, 12
have a mean of:
11
But:
10, 11, 13
have a mean of:
11.33…
Statistics Mean Symbol vs. Similar Statistical Expressions
| Symbol / Term | Meaning | Typical Use |
|---|---|---|
| x̄ | Sample mean | Average of sample observations |
| μ | Population mean | Average of an entire population |
| Σ | Summation | Indicates values should be added |
| Median | Middle value | Describes the center of ordered data |
| Mode | Most frequent value | Identifies the value appearing most often |
| Average | General term for a central value | Common everyday language |
| xᵢ | Individual observation | Represents one data value |
| n | Sample size | Number of observations in a sample |
| N | Population size | Number of members in a population, depending on convention |
Key Insight
The easiest way to remember the distinction is simple: x̄ normally tells you the average of a sample, while μ tells you the average of a population. Once that difference becomes familiar, many introductory statistics formulas become much easier to understand.
How to Respond When Someone Uses the Statistics Mean Symbol
If someone sends you x̄ and you need to respond, your answer depends on the situation.
Casual Reply
“x-bar means the sample average, right?”
Funny Reply
“The tiny line above x just means it went through statistics training 😂”
Mature Reply
“If you’re referring to standard statistical notation, x̄ represents the sample mean.”
Respectful Reply
“As I understand it, x̄ represents the mean of the sample, while μ is generally used for the population mean.”
If You Need Clarification
“Do you mean x-bar as the sample mean, or are you referring to a different notation?”
That last response is especially useful because mathematical symbols can occasionally have different meanings in different contexts.
Regional & Cultural Usage of the Statistics Mean Symbol
Mathematical notation is unusually universal, but teaching styles can vary between cultures and education systems.
Western Culture
In the United States, Canada, the United Kingdom, Australia, and similar educational environments, students commonly encounter x̄ for sample means and μ for population means.
Textbooks may introduce the distinction early in introductory statistics courses.
Asian Culture
Across many Asian education systems, students frequently encounter the same international statistical notation.
However, classroom explanations may differ. Some teachers emphasize formulas and examination techniques, while others focus more heavily on conceptual understanding.
Regardless of teaching style, x̄ and μ generally retain their standard statistical meanings.
Middle Eastern Culture
Statistical notation is also widely used in mathematics, economics, engineering, medicine, and research across Middle Eastern educational settings.
Because mathematical notation crosses language boundaries, a student can often understand x̄ = 50 even when the surrounding explanation is written in another language.
Global Internet Usage
Online educational communities have made statistical notation even more accessible.
Students can now encounter the same symbol in videos, discussion boards, digital textbooks, calculators, and study groups from different parts of the world.
This creates a shared mathematical vocabulary.
Gen Z vs. Millennials
Younger learners may encounter statistical symbols through short educational videos, online classes, interactive exercises, and social media explanations.
Millennials may have learned the same concepts primarily through textbooks, classroom lectures, or printed worksheets.
The notation itself has not fundamentally changed. What has changed is how people learn and explain it.
Is the Statistics Mean Symbol Safe for Kids?
Yes. The statistics mean symbol is completely safe and educational for children.
The main issue is not safety but age-appropriate explanation.
For younger students, it is better to start with the word average before introducing notation.
For example:
“If three children have 6, 8, and 10 stickers, their average number of stickers is 8.”
Once the concept is understood, you can introduce:
x̄ = 8
This approach makes the symbol feel like a shortcut for an idea the child already understands.
FAQs About the Statistics Mean Symbol
What is the statistics mean symbol?
The statistics mean symbol commonly refers to x̄, pronounced “x-bar,” which usually represents the mean or average of a sample.
What does x̄ mean?
x̄ means the sample mean. It is calculated by adding the sample values and dividing their sum by the number of observations.
What is the symbol for population mean?
The Greek letter μ (mu) is commonly used to represent the population mean.
What is the difference between x̄ and μ?
x̄ generally represents a sample mean, while μ represents a population mean. The key difference is the group of data being described.
How do you calculate x̄?
Add all the sample observations and divide the total by the number of observations:
x̄ = Σx / n
Is x-bar the same as average?
Usually, yes, when referring to the arithmetic mean of a sample. “Average” is the everyday term, while x̄ is statistical notation.
What does the line above x mean?
The line above x is called a bar. In x̄, it indicates that x represents an average rather than an individual observation.
Conclusion
The statistics mean symbol may look complicated at first, but its basic idea is remarkably simple.
x̄, or x-bar, normally represents the sample mean—the average of a set of sample observations. The symbol μ is generally used for the population mean, or the average of an entire population.
Once you understand that distinction, statistical formulas become less mysterious. The symbols are simply shortcuts that allow mathematicians, researchers, students, and analysts to communicate precise ideas quickly.
So the next time you see x̄, don’t let the little line above the x intimidate you. Read it as “sample average.” That one small mental translation can make statistics feel much more approachable.
The real skill isn’t memorizing symbols. It’s understanding what they are trying to tell you.
descover more post
What Does the Clover Symbol Mean Luck Love Culture More …
Statistical Symbol for Mean What It Means How to Use It and …
What Does the Infinity Symbol Mean in Apple Music Complete …

Kavon is a passionate content creator and digital researcher who specializes in decoding symbols, meanings, and modern internet language. With a strong focus on clarity and authenticity, Kavon writes in a way that makes complex ideas simple, relatable, and useful for everyday readers.
Known for a hardworking mindset and attention to detail, Kavon is dedicated to creating content that genuinely helps people understand the deeper meanings behind words, signs, and online expressions. Every article is crafted with care, combining research, real-life insight, and a reader-first approach.
Through Symblpedia, Kavon aims to build a trusted space where curiosity meets clarity—helping users find answers that are not only accurate but also meaningful and easy to understa